Trigpointing and point.py
One interesting email I received after posting geolocation and path
cross asked if the module could be used for quick visualisation when
trigpointing. Now that I’ve found out what trigpointing is I believe it
can, and I’ve added a couple of extra features to make it easier for
trigpointers to use the upoints module.
Firstly, for those who don’t know, trigpointing is the activity of tracking down trigpoints and recording them. I guess you could make a parallel to trainspotting, but with a navigational slant. Some people apparently use GPS units to track down the trigpoints, that I’d suggest makes it just hiking with trigpoints as waypoints. And some people, like Robert Johnson who mailed me, prefer to do the navigation with just an ordnance survey map and a compass which in my eyes makes it a little more interesting. Also, a few sites I’ve found with Google seem to suggest that many trigpointers like to use triangulation, although I suspect some mean trilateration, to travel between trigpoints as a navigational challenge.
Note
Robert tells me that TrigpointingUK is a popular website among trigpointers in the UK. It contains information about many of the trigpoints you can find, such as the one closest to me at Bygrave
Anybody who knows me well will attest that that I’m quite the navigation
geek, mostly just as a curiosity being that what we’re really talking
about is just applications of specific branches of math. As such,
I actually find the concept of trigpointing by hand quite intriguing.
That being said technology is here to assist us, and with that let me
introduce trigpoints a simple extension over the
original edist.py script.
>>> from upoints import trigpoints
>>> database_location = urllib.urlopen("http://www.haroldstreet.org.uk/waypoints/alltrigs-wgs84.txt")
>>> Trigpoints = trigpoints.Trigpoints(database_location)
>>> print(len(Trigpoints))
6557
Thanks to the online database we now have the locations of all the Ordnance Survey trigpoints in an easy to use format – a Python dictionary.
If I’d like to see trigpoints close to me, say within 20kM, and less than 60m above sea level I could tap the following in to my IPython session:
>>> Home = trigpoints.point.Point(52.015, -0.221)
>>> for identifier, trigpoint in sorted(Trigpoints.items()):
...     if Home.__eq__(trigpoint, 20) and trigpoint.altitude < 60:
...         print("%s - %s" % (identifier, trigpoint))
500936 - Broom Farm (52°03'57"N, 000°16'53"W alt 37m)
501822 - Crane Hill (52°11'10"N, 000°14'51"W alt 58m)
503750 - Limlow Hill (52°03'31"N, 000°04'20"W alt 59m)
505681 - Sutton (52°06'24"N, 000°11'57"W alt 55m)
Or we can display all the trigpoints within a given region. For example, to show trigpoints within the region from 51°52‘15”N, 000°28‘29”W to 52°09‘07”N, 000°01‘52”W.
>>> latitude_min = trigpoints.utils.to_dd(51, 52, 15)
>>> longitude_min = trigpoints.utils.to_dd(0, -28, -29)
>>> latitude_max = trigpoints.utils.to_dd(52, 9, 7)
>>> longitude_max = trigpoints.utils.to_dd(0, -1, -52)
>>> for identifier, trigpoint in sorted(Trigpoints.items()):
...     if latitude_min < trigpoint.latitude < latitude_max \
...       and longitude_min < trigpoint.longitude < longitude_max:
...         print("%s - %s" % (identifier, trigpoint))
500928 - Bromley Common (51°52'17"N, 000°06'14"W alt 118m)
500936 - Broom Farm (52°03'57"N, 000°16'53"W alt 37m)
501097 - Bygrave (52°00'38"N, 000°10'24"W alt 97m)
501417 - Cherrys Green (51°55'13"N, 000°01'52"W alt 126m)
501428 - Chicksands North Radio Mast (52°02'46"N, 000°22'17"W alt 62m)
501928 - Croydon Hill (52°07'37"N, 000°05'26"W alt 78m)
502034 - Deacon Hill (51°57'19"N, 000°21'46"W alt 173m)
502908 - Hammer Hill Farm (52°04'32"N, 000°24'05"W alt 89m)
503138 - Higham Gobion (51°58'48"N, 000°23'55"W alt 75m)
503750 - Limlow Hill (52°03'31"N, 000°04'20"W alt 59m)
503774 - Little Easthall Farm (51°53'23"N, 000°15'23"W alt 140m)
504024 - Marsh Farm Mh (51°55'24"N, 000°27'39"W alt 152m)
505392 - Sish Lane (51°54'39"N, 000°11'11"W alt 136m)
505681 - Sutton (52°06'24"N, 000°11'57"W alt 55m)
505852 - Therfield (52°01'03"N, 000°03'38"W alt 168m)
506163 - Warden Hill (51°55'20"N, 000°24'53"W alt 195m)
506165 - Warden Tunnel (52°05'15"N, 000°22'30"W alt 84m)
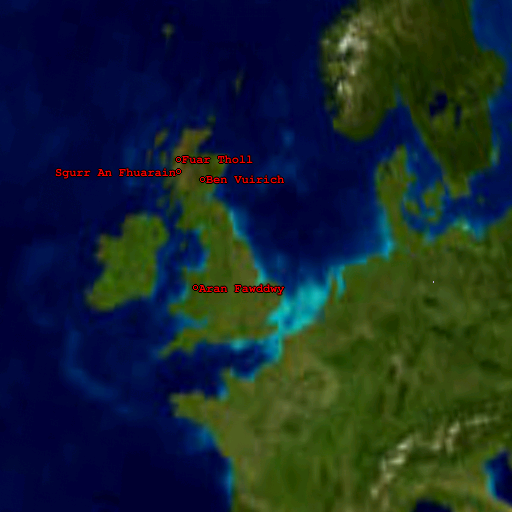
Or we could generate a file to use with xearth that contains all the trigpoints above 1000m above sea level:
>>> from upoints.utils import dump_xearth_markers
>>> high_markers = {}
>>> for identifier, trigpoint in Trigpoints.items():
...     if trigpoint.altitude > 1000:
...         high_markers[identifier] = trigpoint
>>> f = open("high_markers.txt", "w")
>>> f.write("\n".join(dump_xearth_markers(high_markers)))
>>> f.close()
Now we can use xearth, or xplanet, to visualise the trigpoints that are higher than 1000m. If you start xearth with the command xearth -pos "fixed 57 -4" -mag 25 -noroot -markerfile high_markers.txt you will see an image similar to the one on the right.
You could, of course, use dump_xearth_markers() to
dump the entire trigpoint database, but with over 6000 locations the
result is just going to be a sea of blurred text when rendered.
And it is possible to fold the generation of the high_markers
dictionary in to a single operation using lambda expressions and
filter() such as:
>>> high_markers = dict(filter(lambda x: x[1].altitude > 1000,
...                            Trigpoints.items()))
However, you opinion on whether this is cleaner or not depends a lot on
your background. If only you could run filter() on a dictionary
directly, this would definitely be the better solution. I’m going to
continue using the unrolled version on this page because it seems more
people are comfortable with them in spite of me favouring the
filter() and lambda() version, but it is just a matter of
taste and yours may vary.
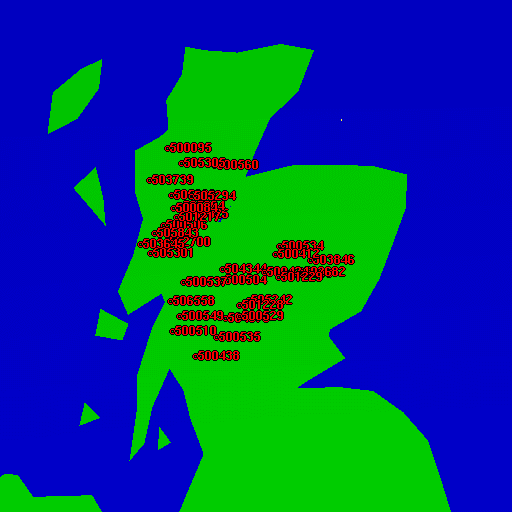
Using trigpoints you could generate marker file for
locations with an altitude of between 900m and 910m using their location
names as labels.
>>> display_markers = {}
>>> for identifier, trigpoint in Trigpoints.items():
...     if 900 < trigpoint.altitude < 910:
...         display_markers[identifier] = trigpoint
>>> f = open("display_markers.txt", "w")
>>> f.write("\n".join(dump_xearth_markers(display_markers,
...                                            "name")))
>>> f.close()
The result of how that query could be shown with xplanet can be found to the right.
The Trigpoint class inherits from the
Point class, and therefore has all the same methods it
does. You can calculate distances and bearings between trigpoints. I suggest
reading the HTML files generated by Sphinx that are included in the tarball to
see how it all works, including some more examples.
Note
And on a slight tangent, in my mind one of the best reasons for using
Python is now evident, Nokia provide Python builds for some of their
“smartphone” handsets. This means it is possible to use
trigpoints on the move using only the mobile phone
in your pocket, and it makes for a fun diversion from Snake 3D. Even
as a simple database it can be surprisingly useful, especially given
the difficulty of finding the minuscule trigpoint symbol on Ordnance
Survey’s Explorer series maps.
We’re on a journey now, so if you can think of any cool uses for any of
the classes and functions in the upoints tarball drop me a mail.